Introduction

Motor systems drive the U.S. economy: They process raw materials into chemicals, metals and other industrial products. They extrude plastics and move paper and petroleum products. They wash our food. Largely unnoticed, they deliver water, warmth and cool air to schools, offices, hospitals and hotels.

Keeping the nation humming takes tens of millions of motors and the mechanical systems that they drive. Until recently, no one knew how many motor systems are at work or how much energy they use. The U.S. Department of Energy tasked our team at Berkeley Lab to find out. We exhaustively inventoried motor systems nationwide by type, power, use and other parameters. The answer: Motor systems consume about 29% of all U.S. electricity, which costs about $116 billion per year.
Estimated total energy use by motor systems is divided nearly equally between the industrial and commercial sectors (51% and 49%, respectively), as shown at left. In short, the commercial sector has more and generally smaller motor systems, and the industrial sector has fewer but larger motor systems.
Why a Motor Systems Market Assessment Is Needed
Making the nation's 52 million motor systems perform better saves energy cost, reduces emissions and can make the U.S. economy more competitive globally. Motors and motor systems (e.g., pumps, fans, compressors, conveyors, processing systems) would be using significantly more energy today if not for technology improvements, maintenance and upgrades when they fail.
 Accelerating those motor system upgrades would deliver greater efficiency, economic productivity and influence over the U.S. supply chain. Retuning and retrofitting motor systems to use just 2% less electricity would save U.S. businesses $2.3 billion annually.
Motor systems are thus more than the workhorses of the economy: The potential for greater motor system efficiency is a nascent resource for economic vitality and reduced emissions (see sidebar at right).
What the Assessment Covers
Each report addresses critical aspect of the motor systems market and its energy implications.Characterizes the domestic installed base of motor systems by industrial and commercial subsector, use, and horsepower and quantifies the energy used by motors and motor-driven systems (Volume 1: Characteristics of the Installed Base).
Our online data tool serves as a companion to the Volume 1 report, which covers the U.S. installed base of motor systems, their uses, power rating and energy consumption. The tool allows users to generate their own crosscuts, metrics and analysis of the polyphase motor systems in the industrial and commercial building sectors and their operating characteristics.
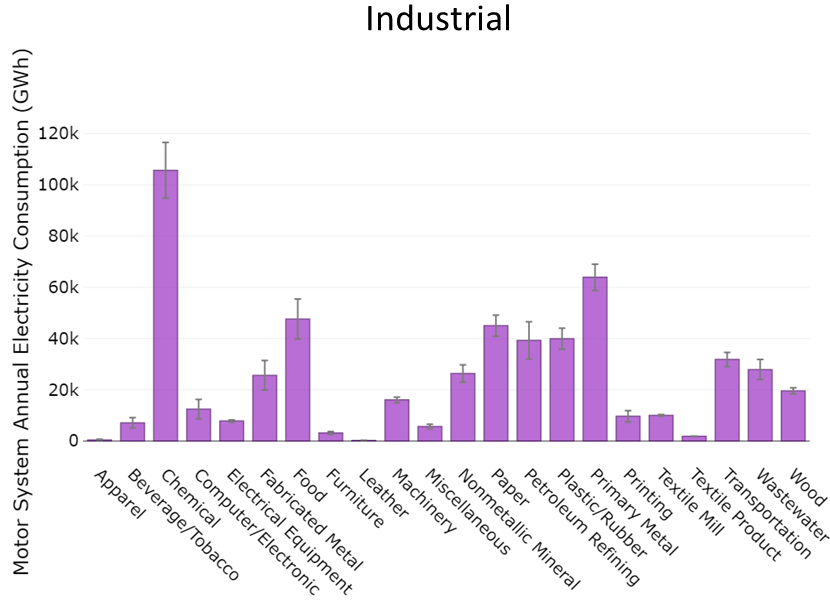
A breakdown of motor system energy use by industrial subsectors, for example, makes clear how critical motor systems are for the manufacturing of chemicals, primary metals and food.
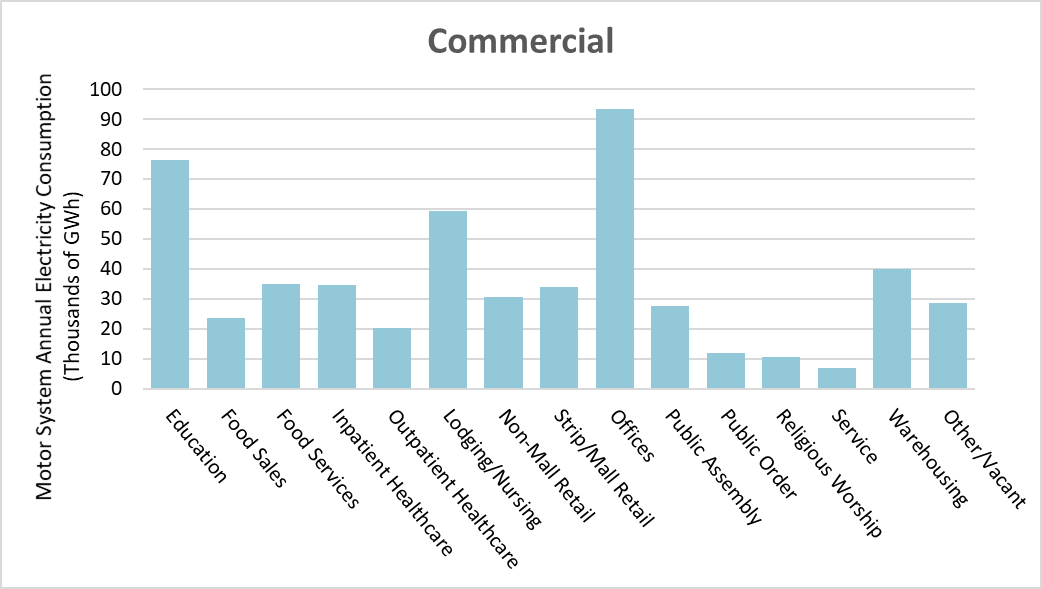
The commercial sector has nearly four times as many motor systems as the industrial sector. They are especially ubiquitous in offices, schools and universities and lodging.
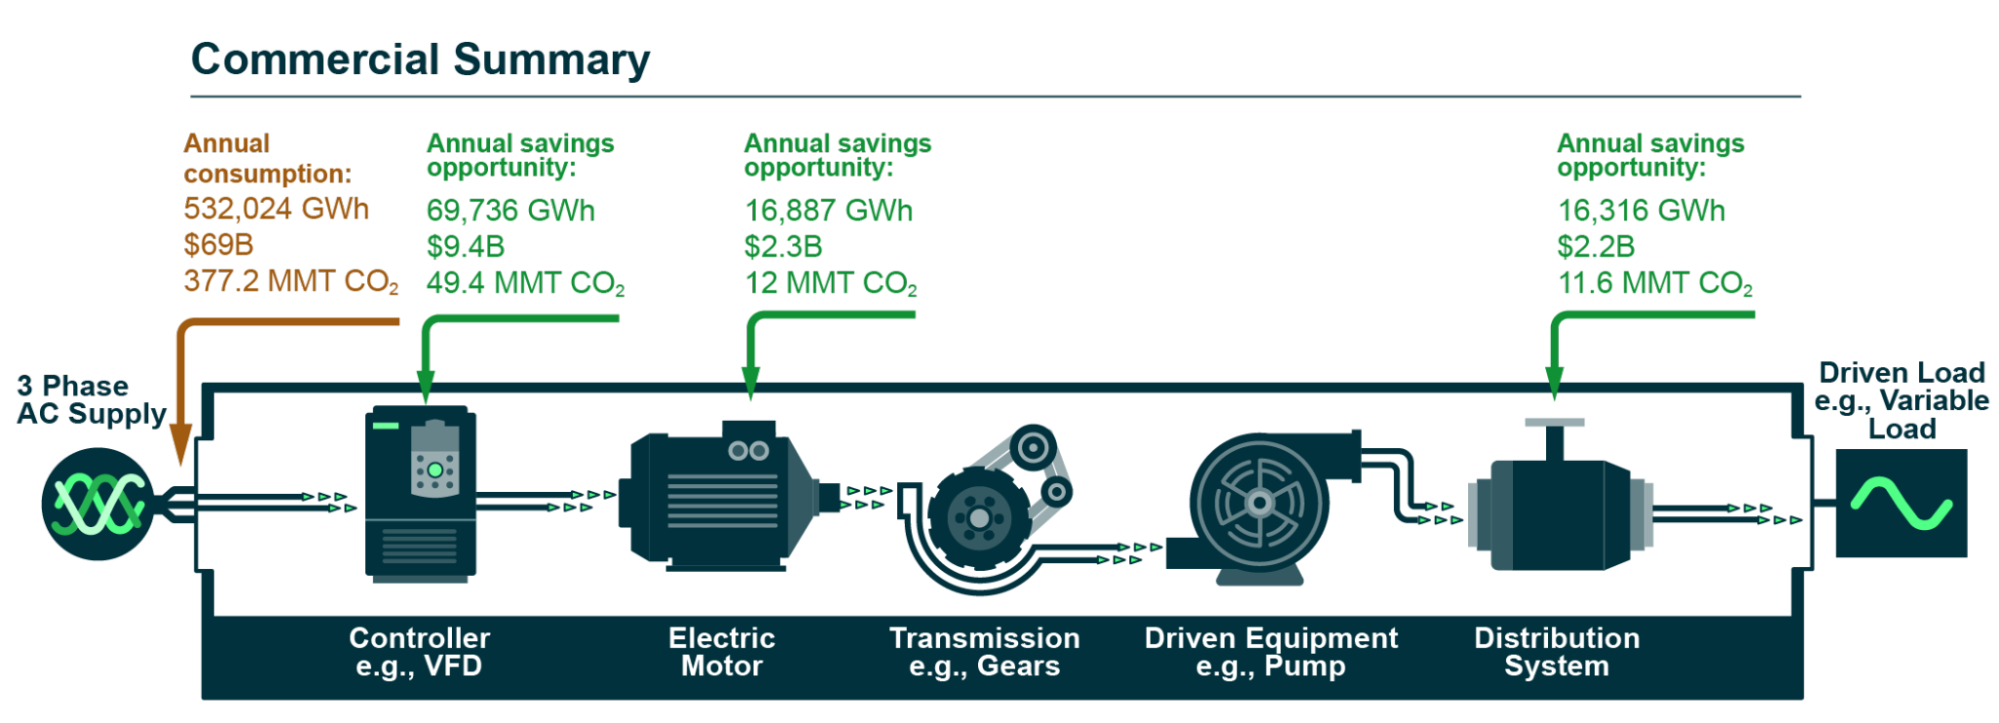
Given the large numbers and widespread use of domestic motor systems, improving their efficiency has very large potential to save energy and energy cost and cut emissions. The potential for energy and cost savings and carbon emissions reductions is distributed across each component in the motor system chain. The figures below capture the potential efficiency gains available in each component, by sector.
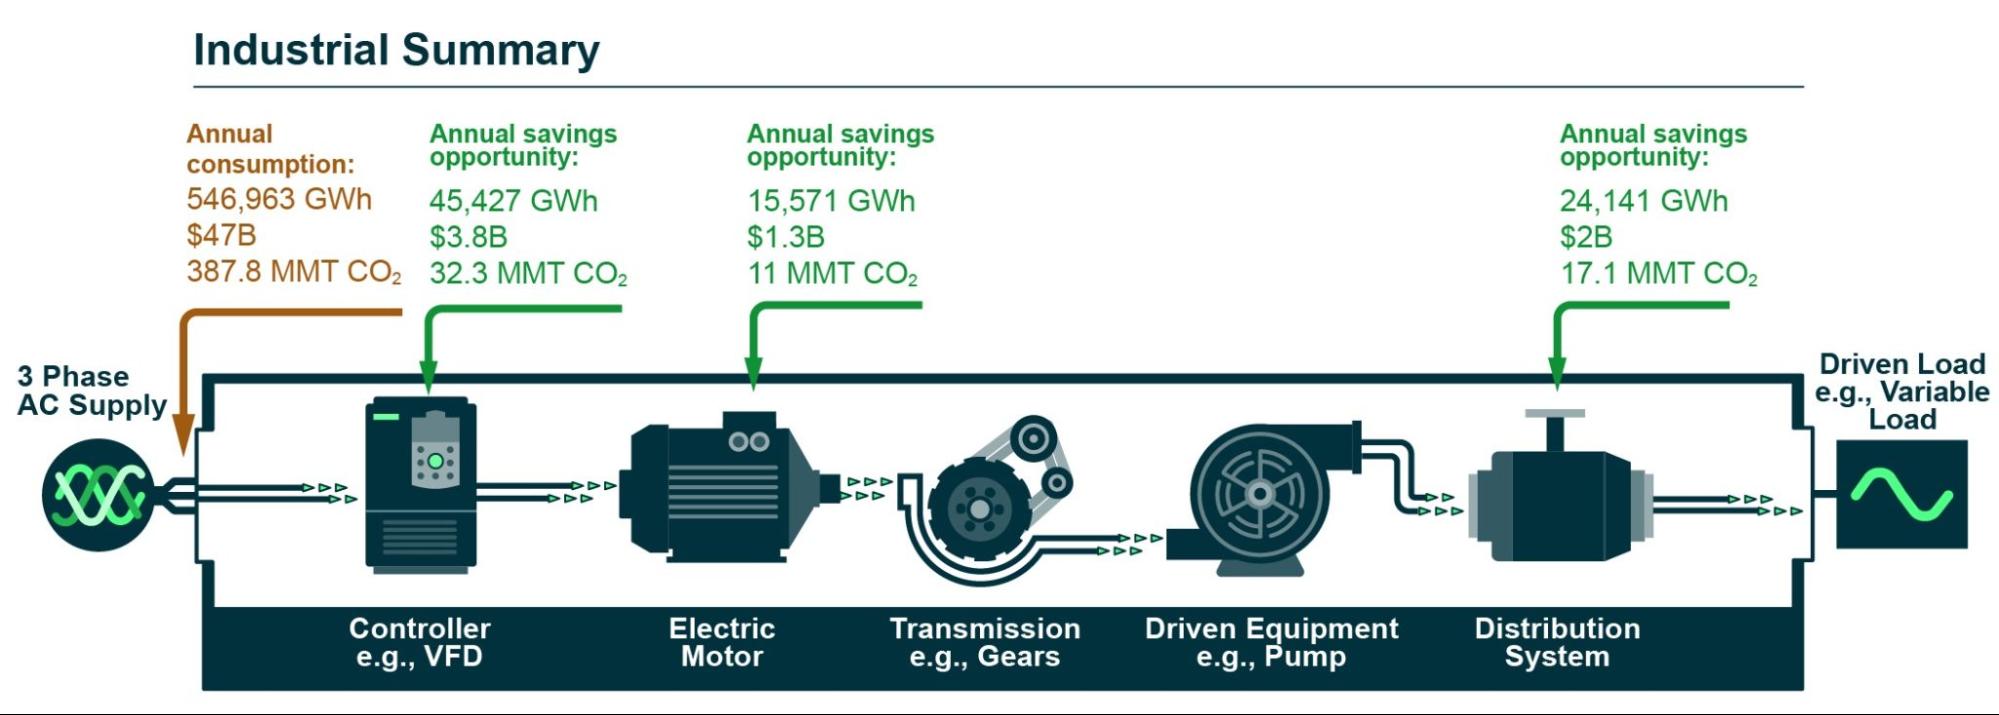
Both sectors offer similar levels of savings at the motor itself, through replacement by updated, correctly sized motors or more advanced technologies. The efficiency potential in each sector varies most outside of the motor. In the industrial sector, significant energy savings and emissions reductions are available downstream of the motor and the equipment that it drives, in the pipes, ducts and conduits that receive air, liquids and materials from motor-driven pumps, fans and conveyors.
Both sectors offer significant savings upstream of the motor through controls allowing motor speeds to match actual loads. Right-sizing and installing variable frequency drives produces somewhat higher gains in the commercial sector.
The MSMA reports and datasets provide essential information for key industrial, commercial and energy-sector actors:
- Users of industrial and commercial motor systems - for improved operational practices and opportunities for saving energy and cost
- Motor-system manufacturers - for targeting product development and marketing to motor user needs and for understanding the global motor supply chain, including availability of materials and components
- Motor-driven equipment manufacturers and distributors - the impact of motor and system efficiency on the performance and operation of their products; identifying markets for current or new products; and the potential impact of the global motor supply chain on current and planned motor-driven system products
- Electric utilities - understanding the magnitude and operational patterns of motor-system energy consumption and the implications for planning and building energy resources and distribution systems
- Administrators of energy-efficiency programs - learning where to target commercial/industrial efficiency programs for the greatest impact on motor system energy consumption and national trends for motor systems and incentive programs
- Energy-efficiency service providers, consultants and purchasing agents for the end user - for understanding the characteristics of motor-driven systems in specific subsectors and quantifying the potential energy savings from current and new products and practices.


